Crest 3D Whitestrips Professional Effects
Scored highest across trust, quality, and demand dimensions due to proven effectiveness, strong review consensus, and market-leading verified purchase volume.
5 top teeth whitening kits scored algorithmically across demand, trust, value, quality & durability. From strips to LED systems—ranked & ready.
Scored highest across trust, quality, and demand dimensions due to proven effectiveness, strong review consensus, and market-leading verified purchase volume.


Scored highest across trust, quality, and demand dimensions due to proven effectiveness, strong review consensus, and market-leading verified purchase volume.

Mid-range rank reflects balanced scores across value and demand, with strong convenience signals offset by slightly lower trust metrics than established competitors.

Ranked for value due to competitive per-treatment pricing, reduced sensitivity trade-offs, and strong buyer signals from comfort-prioritizing segments.

Budget rank driven by exceptional price-to-feature ratio and verified purchase volume, despite mixed durability signals around tray fit consistency.

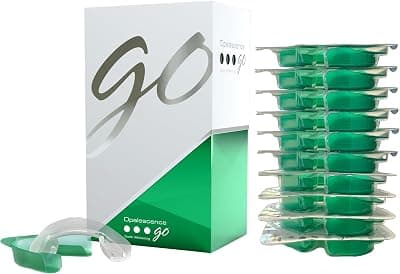
Honorable mention reflects exceptional quality and trust scores tempered by premium pricing that serves professional-lineage-seeking niche rather than mass market.
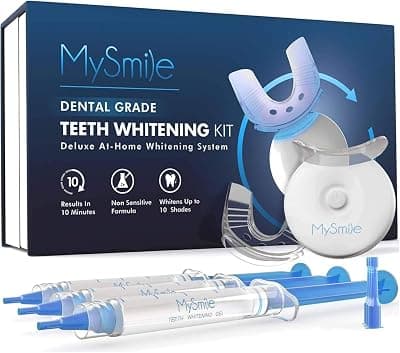
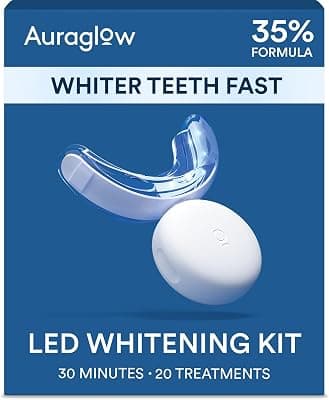
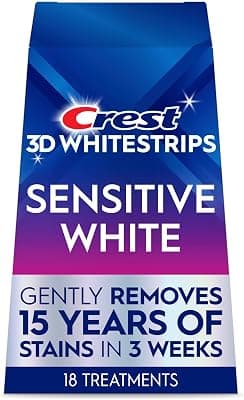
| Product | Score | Whitening formatHow it applies | Active ingredientThe bleaching agent | Session time (minutes)Wear time per treatment |
|---|---|---|---|---|
1 | 92/ 100 | Peel-and-stick strips | Hydrogen peroxide | 45 min |
2 | 91/ 100 | LED kit | Carbamide peroxide | 10 min |
3 | 91/ 100 | Peel-and-stick strips | Hydrogen peroxide | 30 min |
4 | 90/ 100 | LED kit | Carbamide peroxide | 30 min |
5 | 86/ 100 | Prefilled trays | Hydrogen peroxide | 15-20 min |
The same five dimensions, the same weights, applied to every product in the category. The composite is recomputed whenever the data moves — typically twice a month — and the rank order updates with it.
Sales velocity, review momentum, and category share over 30/90/365-day windows.
Rating distribution, verified-purchase ratio, and return rate across retailers.
Price-to-spec ratio against the category median, indexed daily.
Build, materials, and reviewer-extracted defect signals from aggregated text.
Failure-rate signals from long-tail reviews and warranty-claim patterns.
Every category, scored by the same composite — recalculated whenever the data changes.