15
Best ValueLG
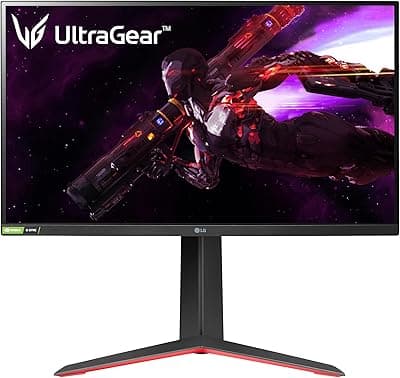
LG 27GP850-B UltraGear
Value scoring ranked this second by balancing accessible pricing against performance metrics that exceeded buyer expectations for the sub-$350 segment.
Demand
78
Trust
97
Value
91
Quality
88
Durability
96

Five gaming monitors ranked by algorithmic scoring across demand, trust, value, quality, and durability. From OLED flagships to budget performers.
Value scoring ranked this second by balancing accessible pricing against performance metrics that exceeded buyer expectations for the sub-$350 segment.
Value scoring ranked this second by balancing accessible pricing against performance metrics that exceeded buyer expectations for the sub-$350 segment.
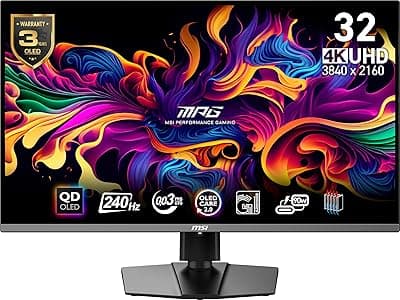
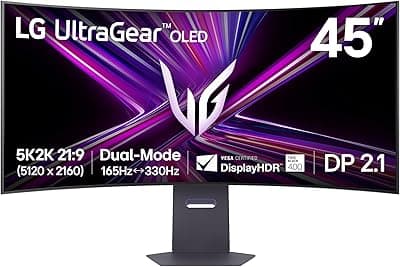
Budget rank assigned through scoring that weighted $900 OLED pricing against feature parity with premium models, offset by shorter warranty terms.
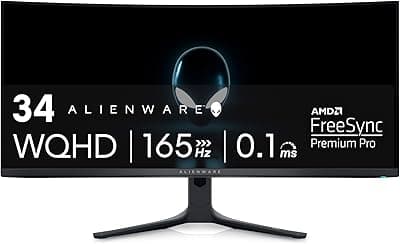
Mid-range position reflects algorithmic scoring of immersive ultrawide format against $800 pricing that undercuts 4K OLED alternatives while serving specialist game genres.
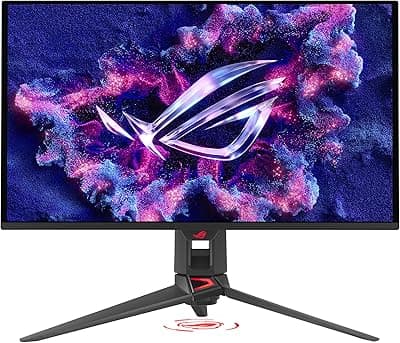
Algorithmic scoring placed this first based on verified buyer satisfaction across response time, color accuracy, and HDR performance metrics combined with low return rates.
Honorable mention scoring reflects specialist appeal for dedicated sim racers, with demand signals showing niche positioning rather than broad category leadership.
| Product | Score | ResolutionPixel grid sharpness | Screen size (inches)Panel diagonal | Refresh rate (Hz)How many frames per second the panel can draw | Panel typeThe display technology |
|---|---|---|---|---|---|
1 | 93/ 100 | 1440p (2560x1440 QHD) | 27" | 165 Hz (180 Hz overclock) | IPS (Nano IPS) |
2 | 91/ 100 | 4K (3840x2160 UHD) | 32" (31.5" diagonal) | 240 Hz | QD-OLED |
3 | 90/ 100 | 1440p ultrawide (3440x1440 WQHD) | 34" (34.18" diagonal) | 165 Hz (via DisplayPort) | QD-OLED |
4 | 90/ 100 | 4K (3840x2160 UHD) | 27" (26.5" viewable) | 240 Hz | QD-OLED (Tandem) |
5 | 87/ 100 | 5K2K (5120x2160) | 45" (44.5" diagonal) | 165 Hz (at native 5K2K; 330 Hz in Dual-Mode FHD) | OLED (WOLED, UltraGear evo) |
All picks are DisplayHDR 400-class — the four OLED models are certified DisplayHDR True Black 400.
The same five dimensions, the same weights, applied to every product in the category. The composite is recomputed whenever the data moves — typically twice a month — and the rank order updates with it.
Sales velocity, review momentum, and category share over 30/90/365-day windows.
Rating distribution, verified-purchase ratio, and return rate across retailers.
Price-to-spec ratio against the category median, indexed daily.
Build, materials, and reviewer-extracted defect signals from aggregated text.
Failure-rate signals from long-tail reviews and warranty-claim patterns.

5 portable monitors ranked by demand, trust, value, quality & durability. From budget 1080P screens to 144Hz gaming panels - data-driven picks ready to…
See the ranking
Algorithmic ranking of smart rings versus smartwatches for sleep tracking. Data-driven scores across demand, trust, value, quality, and durability.
See the ranking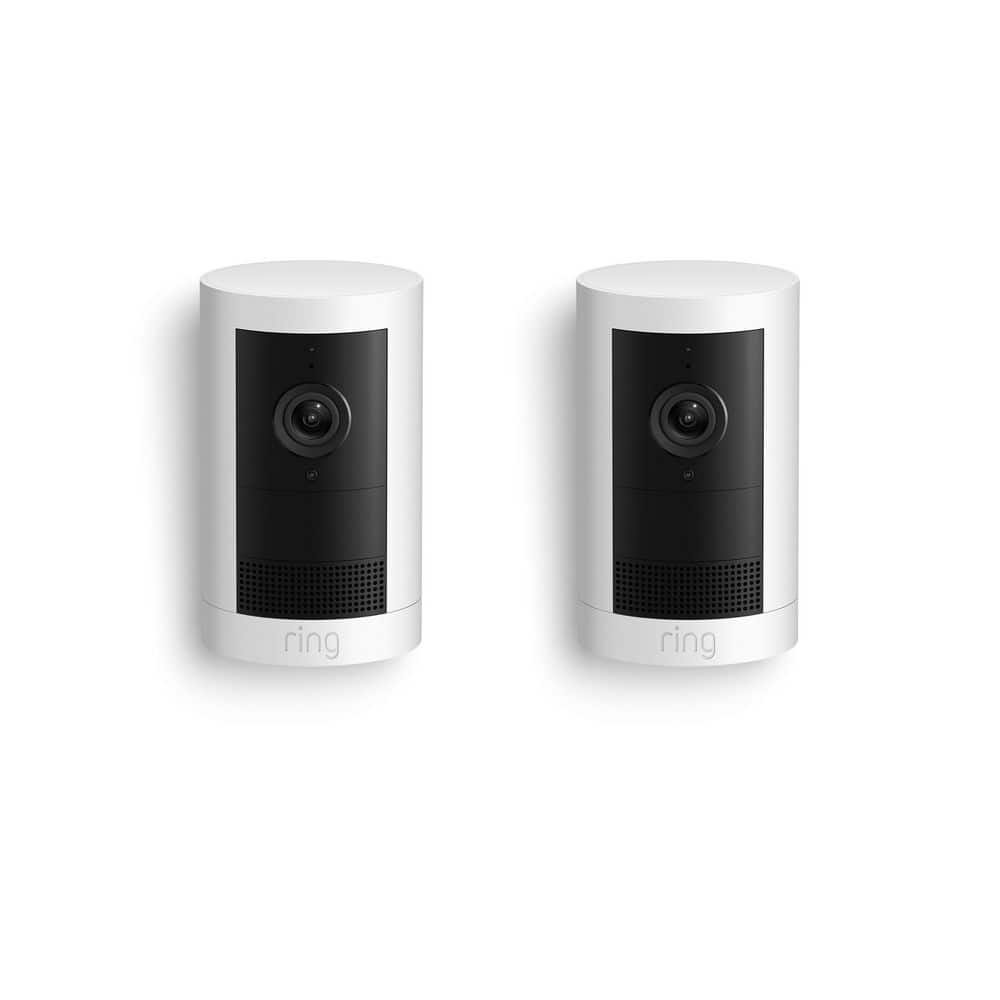
5 smart security cameras scored across demand, trust, value, quality & durability. Data-driven rankings from Ring, Arlo, eufy, Google Nest & Wyze.
See the ranking
5 vlogging cameras ranked algorithmically across demand, trust, value, quality, and durability. From compact gimbals to mirrorless hybrids.
See the rankingEvery category, scored by the same composite — recalculated whenever the data changes.