15
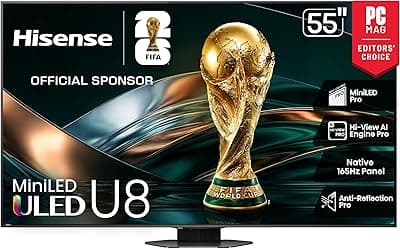
Best OverallHisense
Hisense U8QG Mini-LED
Algorithmic score placed this model first due to exceptional brightness-to-price ratio, strong gaming feature set, and sustained buyer demand across multiple quarters.
Trust
89
Value
95
Quality
96

Five algorithmically ranked TVs for 2026, scored across demand, trust, value, quality, and durability. Data-driven picks from Mini-LED to OLED.
Algorithmic score placed this model first due to exceptional brightness-to-price ratio, strong gaming feature set, and sustained buyer demand across multiple quarters.
Algorithmic score placed this model first due to exceptional brightness-to-price ratio, strong gaming feature set, and sustained buyer demand across multiple quarters.
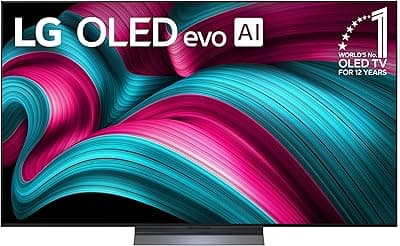
Budget designation reflects price leadership in the OLED segment, with strong quality and durability scores that match or exceed competitors at similar price points.
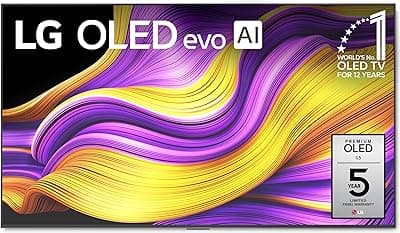
Value score reflects strong price-to-performance ratio in the OLED segment, with high buyer satisfaction and sustained review consensus across cinematic and gaming use cases.
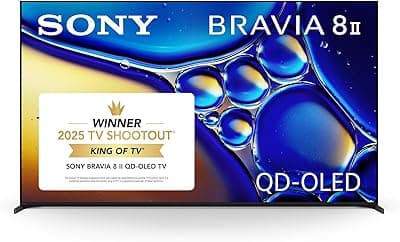
Honorable-mention rank reflects niche appeal for buyers valuing Sony's processing refinement and integrated audio over raw brightness or color-gamut records, with strong trust scores from brand reputation.
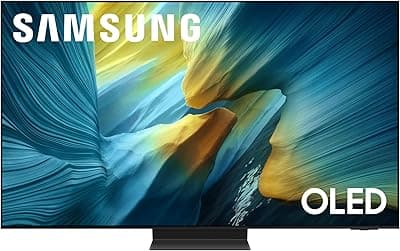
Mid-range rank reflects position between flagship panel technology and accessible pricing, with strong quality and durability scores anchored by Samsung's reliability track record.
| Product | Score | Display techThe panel behind the picture | HDR formatsWhich high-dynamic-range formats it plays | Smart platformThe built-in app system |
|---|---|---|---|---|
1 | 94/ 100 | Mini-LED | Dolby Vision, HDR10, HDR10+, HLG | Google TV |
2 | 92/ 100 | OLED | Dolby Vision, HDR10, HLG | webOS |
3 | 91/ 100 | OLED | Dolby Vision, HDR10, HLG | webOS |
4 | 88/ 100 | OLED | Dolby Vision, HDR10, HLG | Google TV |
5 | 87/ 100 | OLED | HDR10, HDR10+, HLG | Tizen |
All five picks are 4K (2160p) TVs, so resolution isn't a differentiator here - the comparison focuses on panel technology, HDR format support, and smart platform.
The same five dimensions, the same weights, applied to every product in the category. The composite is recomputed whenever the data moves — typically twice a month — and the rank order updates with it.
Sales velocity, review momentum, and category share over 30/90/365-day windows.
Rating distribution, verified-purchase ratio, and return rate across retailers.
Price-to-spec ratio against the category median, indexed daily.
Build, materials, and reviewer-extracted defect signals from aggregated text.
Failure-rate signals from long-tail reviews and warranty-claim patterns.

Five wireless over-ear headphones ranked algorithmically across demand, trust, value, quality & durability. Data-driven picks from $279-$599.
See the ranking
5 portable Bluetooth speakers ranked by demand, trust, value, quality, and durability. Data-driven analysis across premium, mid-range, and budget picks.
See the ranking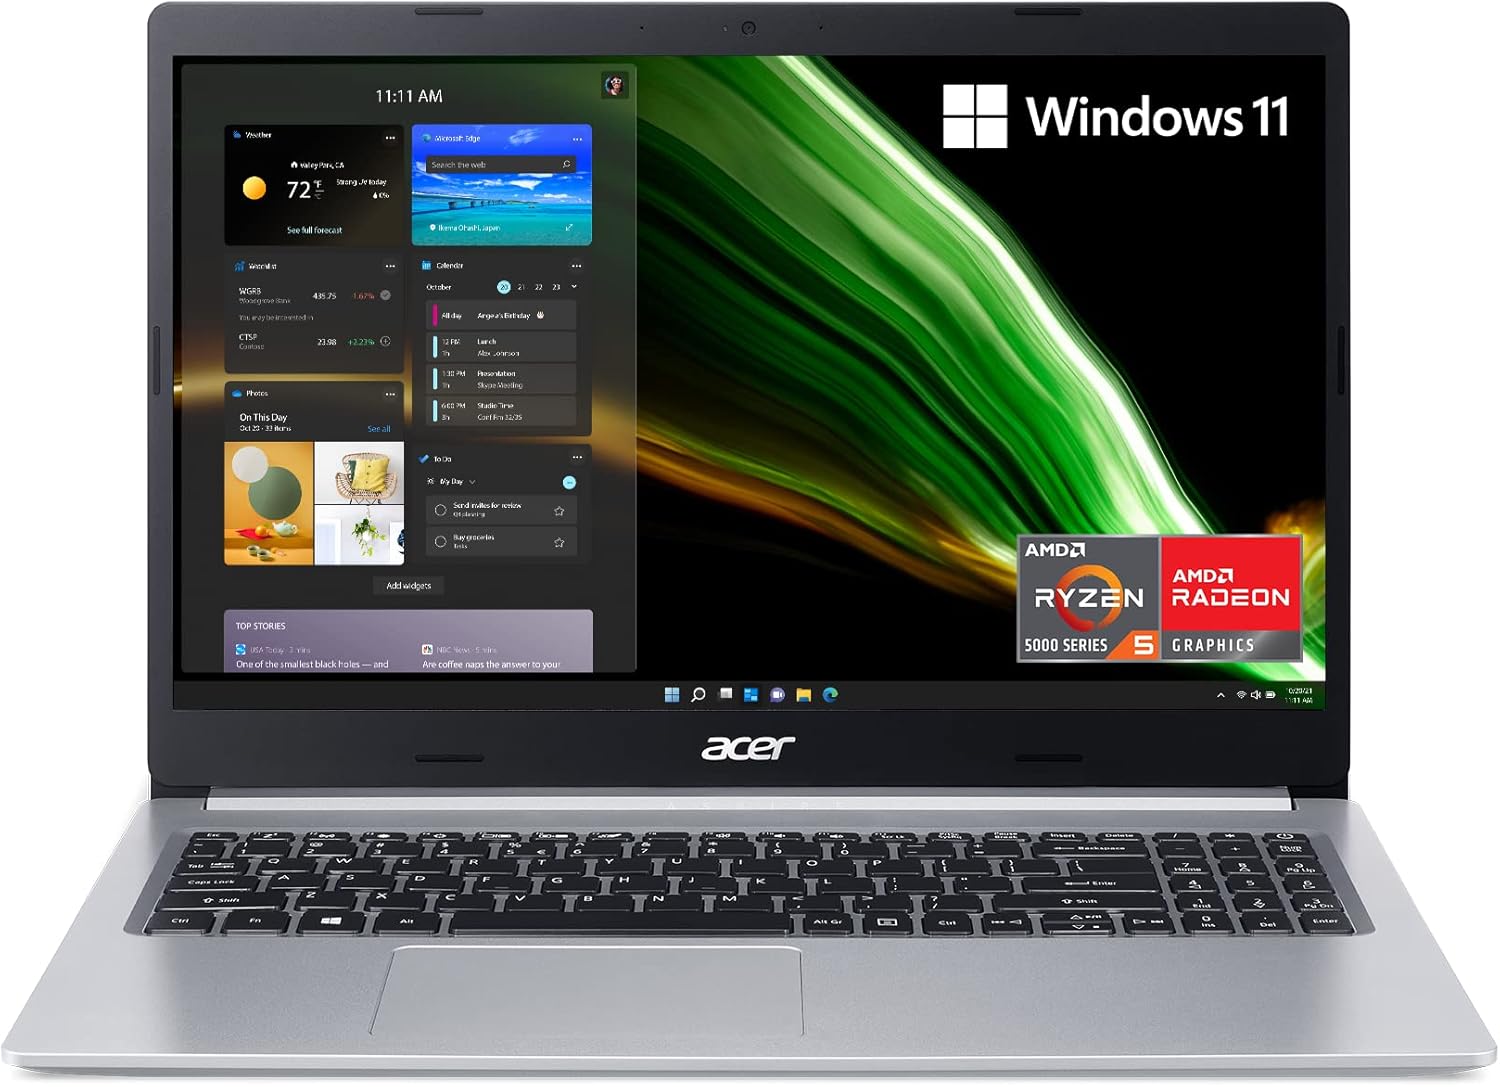
5 budget laptops for college students ranked by demand, trust, value, quality & durability. Data-driven picks from $499 to $1069, scored algorithmically.
See the ranking
5 active cameras ranked by demand, trust, value, quality, and durability. Data-driven picks from budget to premium performance.
See the rankingEvery category, scored by the same composite — recalculated whenever the data changes.